We often get asked by clients, what specific product attributes impact overall consumer satisfaction? Penalty Analysis tells us exactly that; which attributes are driving negative or positive perceptions of a product. So, the next time you have a product that is ready for consumer testing, consider Penalty Analysis to maximise the value of your data.
Why use Penalty Analysis in product testing?
One of the great things about using Penalty Analysis is that it is simply a matter of choosing the correct questions, and analysing the data in a certain way. This makes it an extremely valuable method that can be used whenever product tests are being conducted. The questions needed are often asked in an affective test survey used to measure acceptability or liking. By utilising Penalty Analysis we have the added value of:
- Identifying drivers of dislike: helping researchers pinpoint specific attributes that consumers find undesirable.
- Quantifying impact on liking: how much a sensory attribute deviates from the ideal and how that deviation penalises consumer liking. This helps prioritise which attributes need to be adjusted to improve the product.
- Guiding product optimisation: by understanding which attributes most significantly reduce liking, product developers can focus on modifying these aspects to enhance the product's appeal.
- Efficient resource allocation: penalty Analysis allows for more targeted product development, ensuring resources are invested in the most impactful way rather than in areas that may not significantly affect consumer preference.
How is the data collected?
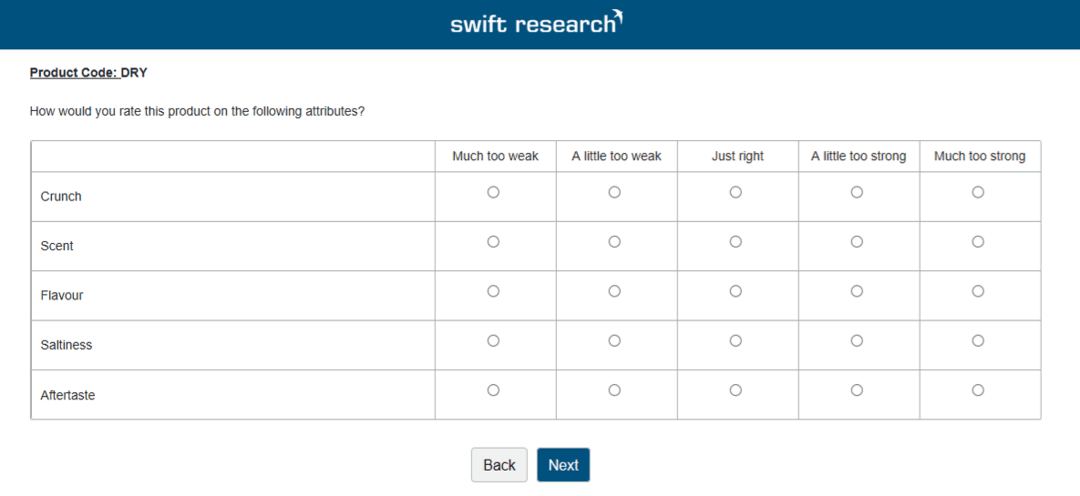
During the questionnaire design stage, attributes you want to evaluated must be carefully chosen. For example, if we were testing a variety of flavoured crisps, we ask participants to rate each attribute whether it performs weakly, strongly or just right. The specific scale can change for different questions, or even between attributes to ensure it relates to any way that a product can be described. They will always essentially boil down to a scale from - 'not enough', 'just right' to 'too much'.

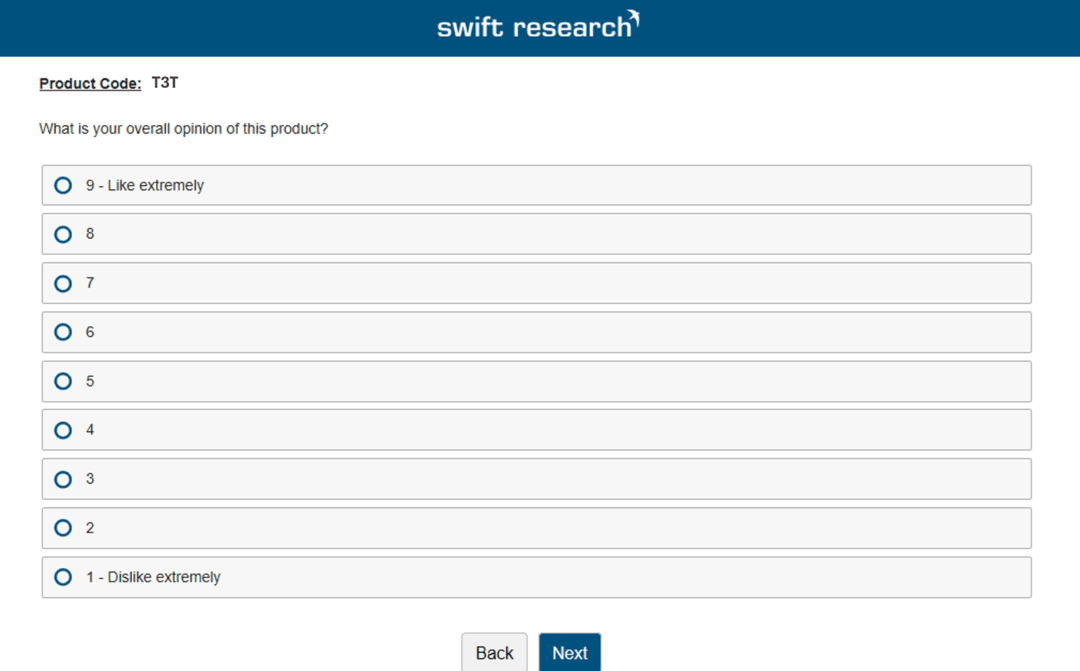
Next, we need to assess the overall satisfaction, usually with a question like the example below:

Participants are then provided with the test samples with blind codes to prevent bias, and under test conditions just like any other product test.
Crunching the numbers
After the data has been collected Penalty Analysis allows us to do a number of interesting things:
- Attribute classification: Identify attribute data as "Just About Right" (JAR) or "Not Just About Right" (NJAR).
- Calculate penalties: This provides us with a figure we can use to visualise the decrease in overall satisfaction when an attribute is NJAR (not just about right), this is done for each attribute.
- Gauge proportion of NJAR consumers: Here we need the proportion of consumers rating each attribute NJAR, weighted by the proportion of the sample for each attribute.
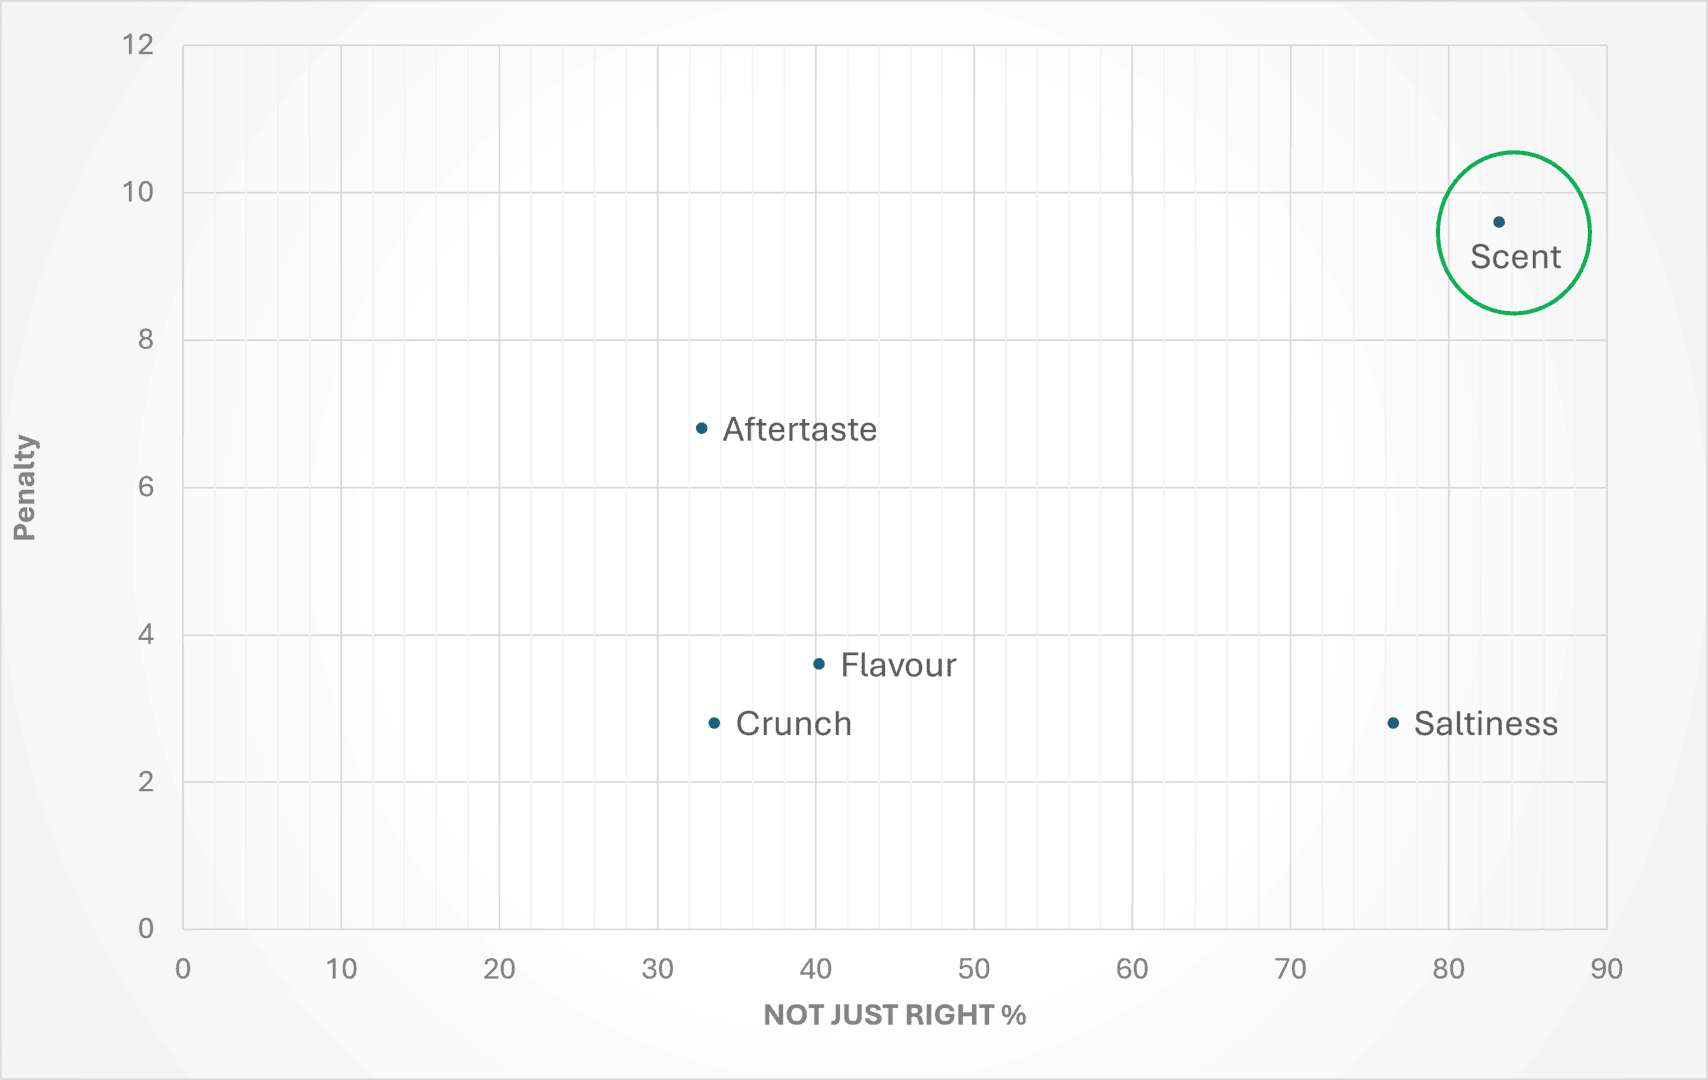
We can then chart this together to visualise which attributes would be in the most need of improvement as they have the largest drop in liking for those who deem the product not 'just right' in that attribute.
To use our example of a crisp product test, we can see that scent received the highest penalty score, while having the most people feeling it was not 'just right' when evaluating the scent. This means focused product development on that attribute would be the most beneficial effect on product liking, (and hopefully) purchase intention.

Often the findings from Penalty Analysis will result in further product development, and further testing of the new version. By aligning the product more closely with consumer preference, this ultimately leads to increased sales. This makes Penalty Analysis an ideal addition to a product researchers tool box. There are other analytical techniques available such as key drivers analysis, max diff trade offs but Penalty Analysis has the advantage of being simple and can easily fit into standard testing methodologies.